Debug log - Plugin Guide
Buy NowIf the Enable Debugging option is activated on the plugin's Configure page, the debug log page will allow administrators to view a detailed list of requests made to the public API methods. This list can be filtered by a specific date and time range and by store, offering a granular view of API interactions.
To access the debug log page, click on the Debug Log menu item found under NopAdvance > Plugins > Public API within your nopCommerce admin menu. This action will bring up the debug log page, visually represented in the image below. This page is instrumental in monitoring and troubleshooting API requests, providing invaluable insights into the operational aspects of the plugin.
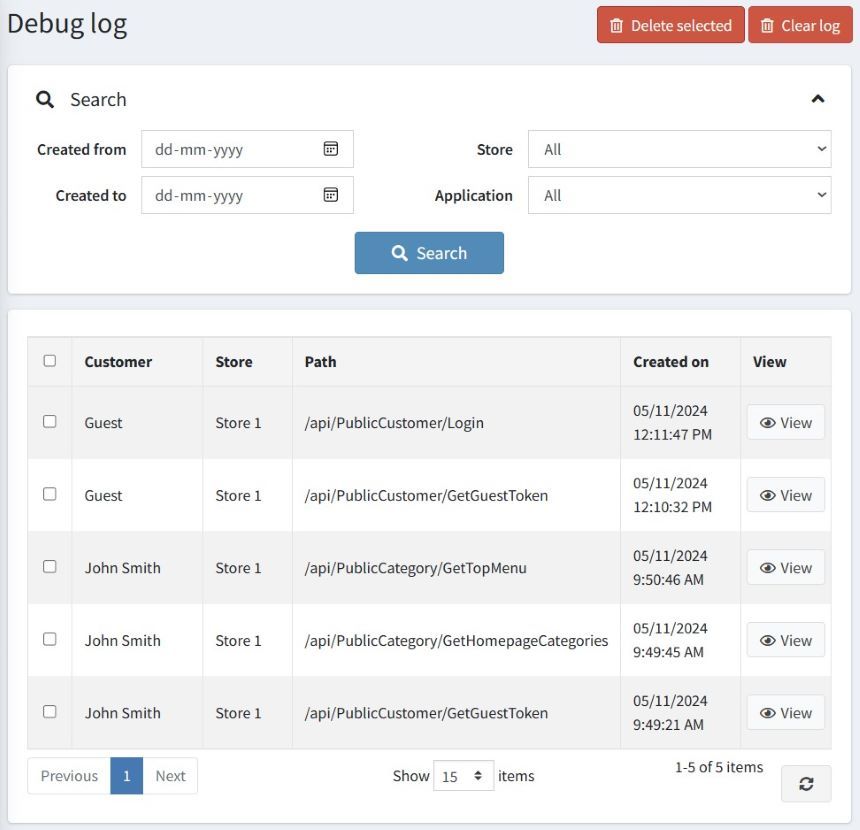
The grid on the debug log page provides a detailed overview of each request, including the following information:
- Customer: Displays the email address of the nopCommerce customer who made the request.
- Store: Indicates the specific nopCommerce store to which the request was directed.
- Path: Shows the request path for the API method used.
- Created on: Details the date and time at which the request was initiated.
Additionally, a View button is available for each entry in the grid. Clicking on this button allows you to access a detailed page showcasing the specifics of a request along with its response. This debug log detail page is designed to offer a comprehensive view of the interaction, facilitating a deeper understanding and troubleshooting of API requests. An example image below illustrates what you can expect to see on this detail page, providing a visual guide to the layout and type of information presented.
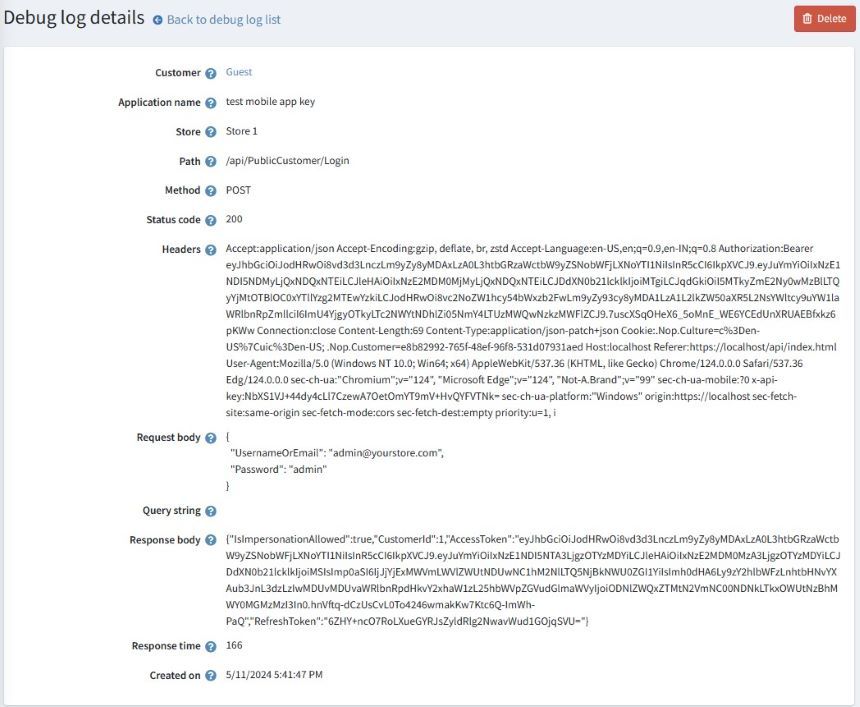
The debug log detail page, as referenced above, showcases a comprehensive breakdown of each API request and response, enriched with the following fields for in-depth analysis:
- Customer: Displays the email address of the nopCommerce customer associated with the request.
- Application name: Name of the application from the API Key associated with this request.
- Store: Identifies the specific nopCommerce store to which the request was targeted.
- Path: Outlines the request path utilized for the API method.
- Method: Specifies the type of HTTP REST Web API method used, such as GET, POST, PUT, or DELETE.
- Status Code: Reflects the standard HTTP status code returned by the request.
- Headers: Represents the standard request headers. By default, this information is encrypted. However, with Enable Debugging activated in the plugin configuration, both request and response headers are presented in an unencrypted format for clarity.
- Request Body: Details the standard request body captured during the API call. Similar to headers, the request body is encrypted unless Enable Debugging is turned on, allowing for clear inspection.
- Query String: Indicates any standard query string parameters included in the API call.
- Response Body: Contains the standard response body provided in response to the API call. This, too, is always encrypted unless Enable Debugging is enabled, at which point it is presented in a readable format.
- Response Time: Measures the total duration, in milliseconds, from the initiation of the request to the generation of the response.
- Created On: Documents the date and time at which the request was made.
This detailed page serves as an invaluable tool for administrators to meticulously review and troubleshoot each interaction with the public API, ensuring efficient resolution of issues and optimization of API usage.